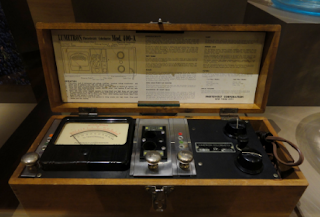
 |
Spectrophotometer |
Spectrophotometer
This is an instrument used to measure absorbance at various
wavelengths. It is similar to the absorption meter except that it uses
diffraction gratings or glass prism to produce monochromatic light.
There are two types of spectrophotometers.
(1) Single beam colorimeter/ spectrophoto meter.
It operates between 325 - 1000 nm wavelength; using a single
source of light, e.g., tungsten filament lamp. It has two photocells. The light
travels along only one pathway. The test solutions and blank are read in the
same position.
(2) Double beam colorimeter/spectrophotometer.
It operates between
wavelength range 185-1000 nm. It has two light sources and two photocells. This
instrument splits the light from the monochrometer into two beams. One beam is
used for reference and the other for sample reading. It eliminates errors due
to fluctuations in the light output, and sensitivity of the detector.
This is
because the final reading is derived from the difference between the
intensities of test and reference beams. Figure 1.5 (a) and (b) show the light
path in single and double beam spectrophotometers respectively.
Setting up the colorimeter/spectrophotometer.
An important step in
colorimetric procedure is the selection of the correct wavelength or filter to
use. The next step is to produce an absorption curve of the color to be
measured by plotting the absorbance against the wavelength using the same
solution. In this way the wavelength that gives the maximum absorption is
determined (Fig. 1.6). For this purpose, serial dilutions should be prepared
from a colored solution such as copper sulphate.
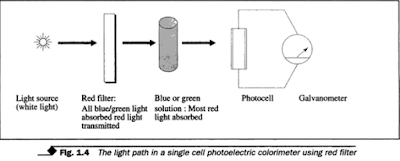 | |
| the light path in a single cell photo cell photoelectric colorimeter using red filter |
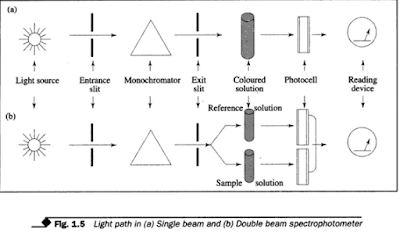 | |||||
| light path in (a) single beam and (b) Double beam spectrophotometer |
 |
| a wavelength showing maximum absorbance |
After selecting the correct filter or wavelength to give
maximum absorption, it is still essential to ensure that the following criteria
are observed:
1. Beer's law is obeyed over the range of expected values.
Note 1. The linear relationship exists only for a certain
range of concentrations. Beyond this range it is no longer valid.
2. The degree of sensitivity is satisfactory, i.e. increase
in concentration corresponds to suitable increase in absorbance.
Checking the wavelength
The calibration curve must be carried out with extreme care.
Freshly prepared reagents and standards and scrupulously clean glassware must
be used. The accuracy of the wavelength calibration of a spectrophotometer
should be checked from time to time, especially after the instrument has been
shifted. This is to ensure that a linear relationship is maintained. For this
purpose, it is ideal to follow the manufacturer's instruction using the special
filters meant for the purpose.
The following two methods can be used to verify Beer's law
and to check the degree of sensitivity.
VERIFICATION OF BEER'S LAW
Method 1
Reagent
Copper sulphate (CuSO4.5H2O): Prepare a 0.5 M solution by
dissolving 12.5 g in 100 ml of distilled water.
Technique
Prepare the following dilutions from the above solution
Read the absorbance of Tube no. 6 using different
wavelengths. Select the wavelength which shows maximum absorbance. Read the
absorbance for each tube. Plot a graph of concentration against absorbance.
Results A straight line relationship shows that the Beer's law is obeyed.
Method 2
Reagent
Dilute Iml of heparin or oxalated blood in 100
ml volumetric flask with 0.4% ammonium hydroxide (NH,OH). The concentration of
diluted blood is 1%.
Technique
From the diluted blood (1%) prepare the dilutions as shown
below.
Follow the same procedure as in Method 1, using Tube no. 1
as blank, to set the zero absorbance. Plot the graph of concentration against
absorbance.
Results
A linear graph shows
that the Beer's law is obeyed.
Note
1. Errors arise due to (a) failure to mix solutions properly
and (b) inaccurate pipetting.
2. Failure to obey Beer-Lambert laws leads to error if the
test concentrations are outside the linear range of the standard.
3. Optically or mechanically faulty instruments as a result
of too much stray light or ambient light entering the instruments or inadequate
warm-up time can give wrong reading.
4. Dirty cuvettes, impure solution and air-bubbles lead to
errors in absorbance values.
5. Avoid precipitation reaction occurring in the cuvettes.
6. Read the results at the recommended time limit to avoid
incomplete colour development or colour fading.
For a more accurate and reliable analysis, it is very
essential to be conversant with the manufacturers instruction on the setting
up, use and maintenance of a particular instrument.






If you have any queries related medical laboratory science & you are looking for any topic which you have have not found here.. you can comment below... and feedback us if you like over work & Theory
.
Thanks for coming here..